My introduction to sales & marketing was the one-week crash course I gave myself when I was put in charge of recruiting as a senior-year cadet in the Northeastern University ROTC program. Since that stressful start, my knowledge has grown through independent study and working closely with many marketing professionals, such as those at Nabisco.
My clients for customer acquisition, segmentation, retention, and/or journey mapping are the three featured on this page plus Toppan Merrill (for litigation-support software & services) and Anchor Bancorp (for journey mapping of new deposit customers).
Minnesota Orchestra
Minneapolis, MN
Understanding our customers and how to sell to them
Prior to 2005, the Minnesota Orchestra segmented its concert attendees (called "patrons") by very broad categories:
- Subscribers (season ticket) or single-ticket buyers.
- For subscribers, the number of concerts in their subscription.
- For type of concert attended, the broad product classifications of Classical, Casual Classics, Weekender Pops, and Adventures in Music for Families.
- Year attended.

Noticeably absent was any reflection of the patron's musical taste beyond "Classical." As a result, New Age concert attenders were grouped together with Country/Western concert attenders in the segment “Weekender Pops.” People who only bought seats in the least expensive section were not differentiated from those in the most expensive. This lack of differentiation was not conducive to understanding our patrons or how best to sell to them. One-to-one marketing was impossible.
This broad "segmentation" had been the basis of the campaign strategy provided to the Marketing Department each year by an outside consulting firm. For two years I had to follow this strategy when creating campaign contact lists in my role as Marketing Database Manager. In my third year, I decided I could produce a better strategy, so I did.

My assessment of the situation:
- We needed to capture musical taste.
- We needed to capture recency, frequency, monetary value, and price sensitivity.
- We needed to capture preferred marketing and sales channels.
In 2004, I developed a new segmentation schema around the needs I had identified and began to create algorithms to identify patrons who fit each segment. For capturing musical taste, I did not overlook the simple method of asking people.
Capturing musical taste
To capture the specific musical tastes of our partrons, I leveraged the Orchestra’s Email Club, an opt-in email feature on our website. In the past, the sign-up screen for the Email Club had asked for musical preferences based on the broad product categories mentioned earlier. I changed that to specific genres: Classical, Jazz, Gospel, Country-Western, New Age, Broadway & American Songbook, etc. Using the email subscriber’s email address, I could tie back the stated musical preferences to customer households and their purchase history. This would prove especially useful for new patrons whose buying history had yet to reflect all their now-stated musical tastes.
Leveraging buying history
As the Marketing Database Manager, I had access to our CRM database and the buying history of our patrons. Besides learning what concerts they attended and when, I could also determine which sales channel they preferred, their price-sensitivity, and their use of convenience products like pre-paid parking. I could also determine recency, frequency, and monetary value.
Developing a schema and a strategy
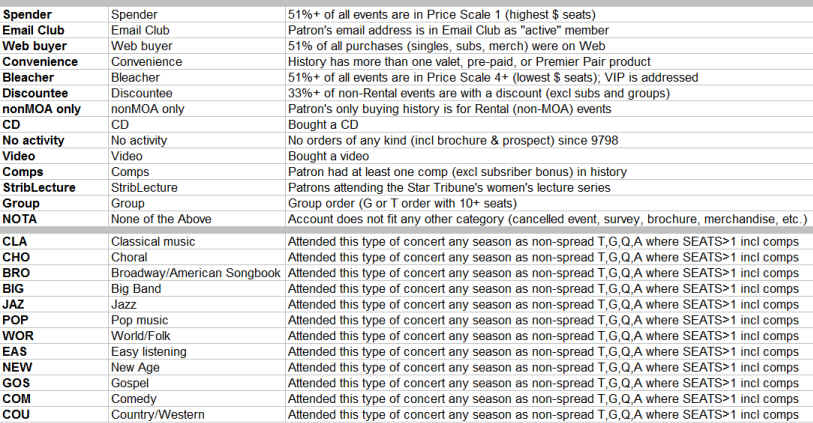
Here are just a few examples of some of my segments I created (by category):
Sales Channel: website, box office, mail, fax.
Marketing Channel: what type of marketing contact usually preceded their concert purchases? Were they a member of the Email Club (giving us permission to market to them by email)?
Musical Taste: e.g., Classical, Gospel, Folk, etc.
Price sensitivity: e.g., Spender, Bleacher, Discountee (the last being someone who bought single tickets largely in response to discounted price promotions or rush tickets).
YMCA of the North
Minneapolis, MN
Identifying critical factors in customer retention

What makes the difference between a YMCA member staying or leaving?
I was asked to answer this question during my two-year consultancy at the YMCA of the North, the parent organization of 26 YMCA branches in the Twin Cities and Rochester, Minnesota.
High attrition is a problem for the entire health club industry. There is a surge of new members in January as people act on their New Year's resolutions, then a steady decline. Research has pointed to genetics as one reason for sedentary behavior in some people. As one YMCA executive explained to me, their biggest competitor is the couch.
While many YMCA members therefore simply drift away, what about the members who left because they were unhappy? What things about the member experience can make the difference between someone deciding to renew their membership or cancel it? My client had me look at their customer satisfaction survey data of the past few years to find the answer.
Understanding the question (before we seek the answer)
Note that my client was not asking me "Why do most defectors leave? Why do most loyal members stay?" Those can be mutually exclusive questions and have a very different focus than "What makes the difference between someone staying or leaving?" Here's why.
Consider a premier service company that gives excellent customer service but charges a premium price for it. If you were to survey loyal customers on why they stayed, they would likely say it was the superior service. The customers who left would likely complain of the high price. Both the loyal customers and the defectors would likely agree the service was excellent but the price was high, so neither service nor price can be the thing that "makes the difference between someone staying or leaving." Instead, ability to pay is likely to be what makes the difference, but the company has no control over that. Therefore, in this scenario, the answers to "Why do most defectors leave? Why do most loyal customers stay?" would not be useful by themselves. If the rate of defection happened to be greater than the rate of customer acquisition, then the answers would be useful. For example, the company might create a discounted offering with a lower level of service to retain its price-sensitive customers. That course of action would only be considered by effectively changing the question from "Why do people leave or stay?" to be "What is driving our negative customer growth?"
Let us now consider the different question I was asked to answer: what makes the difference between someone staying or leaving?
Pretend the city governments of the metropolitan area of Minneapolis, Minnesota have asked you to conduct a survey. The purpose is to identify what makes the difference between someone staying or moving away from the area. To answer the question, you compare the survey responses of people who have since moved away and those who are still living here. Among the most frequent complaints of people who left would undoubtedly be high rent, heavy traffic, and lack of parking. However, even the people who continue to live here will have those complaints. That is simply life in a US city. Therefore, rent, traffic and parking cannot be what makes the difference between most people staying or leaving.

Now consider in our imaginary survey a question about the availability of employment. A person currently employed is not likely to give "employment availabilty" a low score --- and because they have a job, would not likely move away. On the other hand, we would expect someone who has been unemployed or under-employed for a while to not only rate employment availability low, but quite possibly to move to another city for work. "Employment availability" would therefore be a factor that could make the difference between someone staying in or moving from the Minneapolis area. It would therefore be something the city governments should both protect and promote to retain residents.

Wanting to know what to both protect and promote was why the YMCA had phrased their question to me as "What makes the difference between someone staying or leaving?" To answer that question, I needed to find the thing loyals love but defectors detest.
My research resources: survey responses & CRM data
My client's customer satisfaction survey questions were very thorough in their questions. They covered YMCA employee job performance, the member's ability to accomplish what they wanted, the availability of help and equipment, and the quality of those things. For example, about the pool, there were questions about the availability of swim lanes, availability of swim equipment, the quality of the pool water, the lifeguard's enforcement of the rules, and so on. For each question, the respondent was asked to rate the topic on a scale of 1 to 10 (where 10 was "excellent").
As for how to determine if a survey respondent stayed or left the YMCA, the YMCA's CRM system provided the membership renewal dates of each survey respondent. Having chosen six months after the survey as the cut-off for considering a respondent "retained," I could classify each survey respondent as being a "renewer" or a "defector".

Finding the answer
My approach to answering the client's question began with me calculating each question's average score among defectors and the average score among renewers. I then identified those questions where the renewers' average was above the midpoint (a high score) and the defectors' average was below the midpoint (a low score).
For each such question where the renewer average was high and the defector average was low, I calculated the difference between the averages of the two groups. Ranking the questions by their difference between averages, I identified the top N questions based on cut-off criteria the client and I had defined. The resulting list of questions identified the things "loyalists love but defectors detest" --- the things that made the difference between someone staying or leaving. I called these retention-critical factors.
Bigger lessons to learn?
My client had asked me to identify what made the difference between a member staying or leaving. I had identified those specific, critical things. Of course, my findings were only true for the time period of surveys I had studied. Could I generalize my findings so they might anticipate future problem areas that would negatively impact retention? For this, I turned to my study of quality principles in which I had learned of the Four Dimensions of Customer Service from the Customer's Perspective:
TANGIBLES
"You maintain the facilities & equipment."
SKILLS
"You are capable of helping me."
RESPONSIVENESS
"You are available to help me."
EMPATHY
"You understand and respect me."
Thanks to the specificity of the survey questions, I could classify each of my retention-critical areas as one of these four dimensions. In this way, there was not just a thing, Critical Factor X, that needed attention, but the bigger context of customer perception that needed attention.
Looking at these four dimensions, you may think that more than one could apply to a given retention-critical area. For example, if the availability of stationary bicycles was a critical area, you might argue that could be considered as both Tangibles and Responsiveness. The key to classifying is in the name for this four-category rubric: "... from the Customer's Perspective":
If a YMCA member cannot find an open stationary bike to use because all are occupied, the problem is not with the bikes (a tangible); it is with the YMCA branch not responding to high usage by getting more bikes (Responsiveness: "You are available to help me").
If no bikes were available because the ones not in use were broken, then the member would have given a low score to the maintenance of the bikes (Tangibles: "You maintain the facilities & equipment").
As it turned out, all my retention-critical areas fell into just two of these four dimensions. Using the Four Dimensions classification gave the YMCA a longer-term set of priorities beyond just the specific retention-critical areas I had identified.
I presented my findings at a conference of YMCA of the North executives and the 26 branch managers. My findings became the foundation for an organization-wide retention initiative and were incorporated into staff training at the branches.
US Army ROTC
Northeastern University, Boston, MA

Creating a marketing & sales program from scratch
In the case study linked below, we will look at how I, as a senior-year cadet responsible for recruitment, quickly developed a recruiting program for the US Army Reserve Officers Training Corps at Northeastern University in Boston, Massachusetts. It proved so successful --- far surpassing results of previous years --- that my first assignment as an Army officer after graduation was to return to my alma mater and continue as a recruiter for six months.
Besides considering how it was successful in recruiting a record number of students, this study will also consider where my recruiting program was unsuccessful and why.
Specifically, this study will address:
- How I defined my target market and performed market research.
- How I transformed research results into value propositions and a customer journey map.
- The different marketing and sales methods I employed.
- The obstacles I faced.
- Where my program succeeded and where it failed (and why).

Read the case study (PDF 11 pages).
Topics discussed:
- Defining target market
- Market research
- Value propositions
- Journey map
- Mail, telemarketing, and face-to-face sales campaigns
- Medium as part of the message
- Training & empowering telemarketers
- Overcoming rejection
- Recruitment
- Retention
Copyright Will Beauchemin 2024


