
I have been combining MS SQL Server and Oracle databases with user-friendly MS Access interfaces since 2006. Including the clients for the projects showcased on this page, my clients for creating custom reporting & analysis tools are:
Ameriprise Financial: created or enhanced dozens of apps to manage special-rule investment products. Also consulted on and implemented lean metrics.
Wells Fargo Corporate Trust: for managing two (2) billion-dollar housing bond issues, apps that calculate and track interest payments, call payments, and amortization.
Blue Cross/Blue Shield of Minnesota: two apps for regulatory reporting and customer communications.
Target: an app to analyze digital advertising products by performance for the customer and for Target.
MTS Systems: a generator of customer-facing reports of hydraulic oil quality tests.
Minnesota Orchestra: a contact list generator for group ticket sales.
Global Traffic Technologies: CRM, product, & geographic reporting tool.
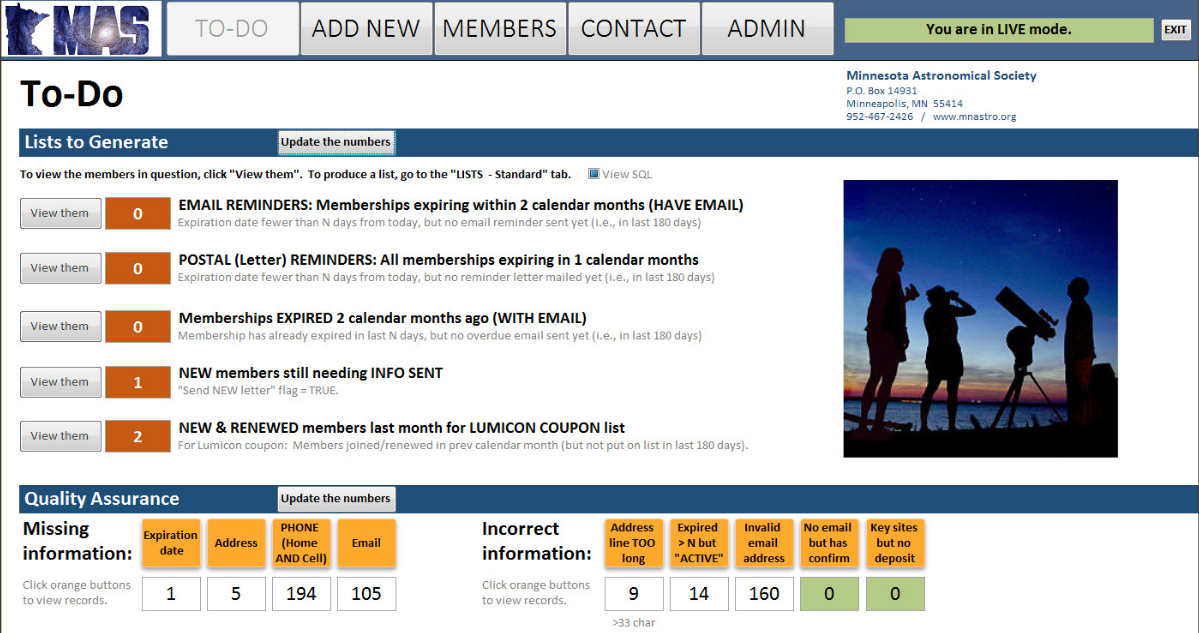
Minnesota Astronomical Society: membership management database & communication tool.
Wells Fargo Home Mortgage: Recruiting candidate database & search interface.
Global Traffic Technologies
Oakdale, MN
Better reporting from NetSuite than NetSuite
The client’s CRM application, NetSuite, did not provide the level of customized reporting needed. For example, it could not provide aggregate (summarized) data for customers by quarter, product class, and other categories. Also, the NetSuite interface did not facilitate the kinds of searches and filtering the client wanted to do.

Facts & requirements
- The NetSuite CRM application used a SQL Server back-end.
- Users needed to be able to search by:
◊ numeric range
◊ date period
◊ look-up value
◊ multiple criteria for a given field
◊ wild-card and boolean criteria
- Users wanted to choose what to see in each row of results.
Challenges
Simplicity in my design of the user interface would be challenged by the large number of ways the client wanted to filter, group, and display. The screen could end up crowded, resulting in an unfriendly user interface.
Another challenge was that the information the client wanted as options would come from many different tables. Not knowing in advance what combinations of choices the user might make, my application could not simply filter a predetermined set of data. Instead, it would need to compose on-the-fly whatever custom multi-join SQL strings were needed to meet the user's wishes.
Analysis
My solution would need to address three areas:
- Keeping the interface simple by displaying user options only as needed.
- Finding a flexible way of producing complex SQL.
- Providing aggregate (summary) data regardless of the results of the search.
Solution
I produced an MS Access/SQL Server/VBA application called aSSRT (a Self-Serve Reporting Tool).
Key to aSSRT's functionality were administrative tables that recorded how one table joined to another and what type of Access form control should be displayed on the form based on the type of search criterion the user wants to define. For example, when the user chooses:
- a numeric range, two boxes appear and accept only numbers as criteria.
- “Opportunity Title (lookup)”, a list box appears listing all Opportunity Titles.
- “Opportunity Title (wildcard)”, a text box appears and accepts wildcard characters.
An additional search option was a drag-and-drop pop-up form I designed. This would appear if the user selected a “multi” search option.
Shown below is a portion of this admin table. The user never saw this table, but when they selected something on which to base their search, this table determined the on-screen control that appeared to accept the user's criteria: a control for numbers (num), date, lookup of available values (lkup), wild card, or drag-and-drop for selecting multiple available values (multi).

aSSRT proved so popular that I was later contracted again to add new functionality.
Minnesota Astronomical Society
Minneapolis, MN
Membership management & communications application

The Minnesota Astronomical Society (MAS) is a non-profit organization promoting public knowledge and enjoyment of astronomy. MAS maintains an observatory and several observation sites around Minnesota and has a growing membership of almost 500 individuals and households. I was one of those members.
Managing membership dues, renewal reminders, rosters of who has keys to the observation sites, and other membership responsibilities is done by one volunteer. The Access database that was used to manage this had been created almost 15 years earlier by a non-programmer. Most of the database’s limited features had ceased to work years ago. As a result, the Membership Coordinator had to spend almost a day each month manipulating the data with Excel to produce renewal letters, reports, and newsletter distribution lists.
The success criteria for the membership management & communication tool I would create was:
Automate tasks and reminders wherever possible.
For code likely to need changes, don't require a developer (like me); let those areas of code be maintainable by the end-user.
Verify data quality before mass communication.
Let the user practice on test data during initial training or any time they wanted to practice.
The MAS Membership Database I created is a wholly MS Access client/server application. It consists of four separate Access files: the user interface, the LIVE data file (production), a TEST data file (always a fresh copy of the LIVE data), and an administrative settings file.
See a slideshow about the user interface and its features.
See examples of my VBA from this app
(including my workaround to permit mail merges from database that is both data source and merge initiator)
Wells Fargo
Minneapolis, MN
Tool to search an entire industry for best employment candidates

In the problem-solving case study "Why finding 30,000 candidates was easier than finding three", I mention having created a user interface to querying the very large number of mortgage loan officers I webscraped from competitor websites. That search tool is called CANINE.
CANINE stands for Candidate Identification & News Database. The news part was a feature that employed my competitive intelligence skills. CANINE was a distributed, split MS Access-only client/server application because a SQL Server database was not available.
With the user interface, recruiters can:
- Find all candidates working within a given radius (miles) around the ZIP code of the Wells Fargo office for which candidates were needed.
- Filter candidates by foreign language skills, loan specialization, and sales awards.
- Quickly see if any candidate was currently or had been considered for employment with Wells Fargo. This feature tied into a Human Resources database.
After my assignment was completed, I was contracted periodically to repeat my nationwide research and replace the candidate table with updated information. At its largest, the database recorded over 30,000 mortgage loan officers around the United States.
See a slideshow about the CANINE user interface and its features.
Copyright Will Beauchemin 2024


